In 1900, Max Planck recognized that all energy radiated from a source is emitted by atoms in quantum states. How would that radical idea relate to the interior of an atom? The answer was first found by investigating the spectrum of light or emission spectrum produced when a gas is highly energized.

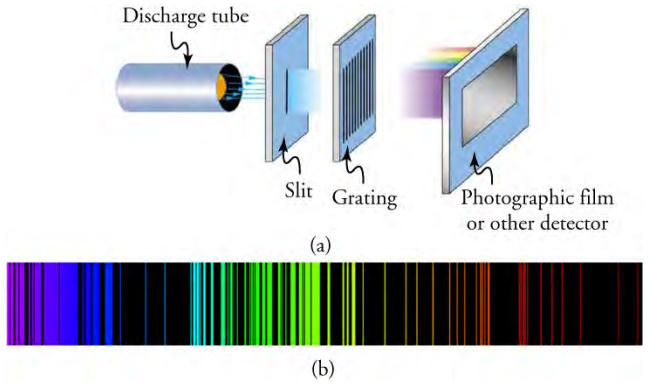
Part (a) shows, from left to right, a discharge tube, slit, and diffraction grating producing a line spectrum. Part (b) shows the
emission spectrum for iron. The discrete lines imply quantized energy states for the atoms that produce them. The line spectrum for each
element is unique, providing a powerful and much-used analytical tool, and many line spectra were well known for many years before they
could be explained with physics.
The diagram above shows how to isolate the emission spectrum of one such gas. The gas is placed in the discharge tube at the left, where it is energized to the point at which it begins to radiate energy or emit light. The radiated light is channeled by a thin slit and then passed through a diffraction grating, which will separate the light into its constituent wavelengths. The separated light will then strike the photographic film on the right.
The line spectrum shown in part (b) is the output shown on the film for excited iron. Note that this spectrum is not continuous but discrete. In other words, only particular wavelengths are emitted by the iron source. Why would that be the case?
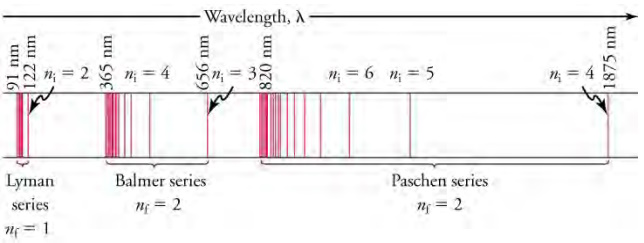
The spectrum of light created by excited iron shows a variety of discrete wavelengths emitted within the visible spectrum. Each element, when excited to the appropriate degree, will create a discrete emission spectrum as in part (b). However, the wavelengths emitted will vary from element to element. The emission spectrum for iron was chosen for the diagram above solely because a substantial portion of its emission spectrum is within the visible spectrum. The diagram above shows the emission spectrum for hydrogen. Note that, while discrete, a large portion of hydrogen emission takes place in the ultraviolet and infrared regions.

A schematic of the hydrogen spectrum shows several series named for those who contributed most to their determination. Part
of the Balmer series is in the visible spectrum, while the Lyman series is entirely in the ultraviolet, and the Paschen series and others are in
the infrared. Values of nf and ni are shown for some of the lines. Their importance will be described shortly.

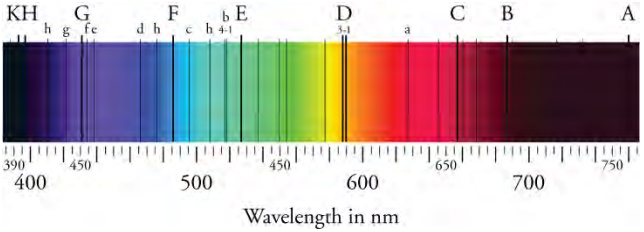
The absorption spectrum of the Sun. The black lines appear at wavelengths absorbed by the Sun's gas exterior. The energetic
photons emitted from the Sun's interior are absorbed by gas in its exterior and reemitted in directions away from the observer. That results
in dark lines within the absorption spectrum. The lines are called Fraunhofer lines, in honor of the German physicist who discovered them.
Lines similar to those are used to determine the chemical composition of stars well outside our solar system.
IJust as an emission spectrum shows all discrete wavelengths emitted by a gas, an absorption spectrum will show all light that is absorbed by a gas. Black lines exist where the wavelengths are absorbed, with the remainder of the spectrum lit by light is free to pass through. What relationship do you think exists between the black lines of a gas's absorption spectrum and the colored lines of its emission spectrum? The image above shows the absorption spectrum of the Sun. The black lines are called Fraunhofer lines, and they correspond to the wavelengths absorbed by gases in the Sun's exterior.
Article source: OpenStax is a nonprofit educational technology initiative based at Rice University. OpenStax's mission is to improve educational access and learning for everyone. Textbooks on OpenStax's site are licensed under a Creative Commons Attribution 4.0 International License.

