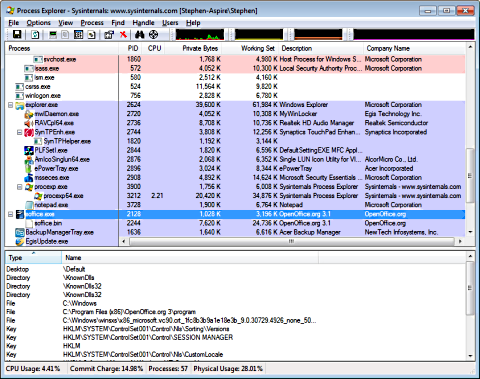
Process Explorer is a more sophisticated version of Windows built-in Task Manager with a rich set of features for collecting information about processes running on your PC. It can be used as a troubleshooting tool to examine processes to see which are utilizing excessive CPU time, or which resources that are held by which process.
Process Explorer is a free utility that can be downloaded from Microsoft. Extract the downloaded file ProcessExplorer.zip, then double click on procexp.exe If a warning message box appears, click on the [Run] button. When the License Agreement message box appears, click on the [Agree] button to run Process Explorer.

Process Explorer displays a list of currently running processes, their names, their dependencies, PID (Process ID), CPU utilization, memory usage, description, and company name. In Process Explorer's View menu, set a checkmark next to Show Lower pane.
If you click on a process in the top pane, you'll see more information about that process in the bottom pane. The information displayed in the bottom pane depends on the mode that Process Explorer is in: if in handle mode it will display the handles that the process selected in the top window has opened; if in DLL mode it will display the DLLs and memory-mapped files that the process has loaded.

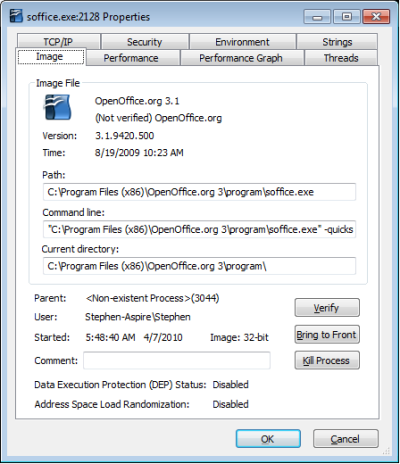
If you double-click on a process in the top pane, that processes Properties dialog box will appear. The processes Properties dialog box, Image tab will tell you the location of processes file and the command line used to start the process. This is important information if you want to remove the program from your computer.
Users often wonder why their are so many instances of svchost.exe running. Svchost.exe (Service Host) is a process that other services call in order to run DLLs. Double-click on a running svchost.exe and select the Services tab to view which DLL that Service Host is running.
To learn more about any process in the list, click on the name of the process to highlight it, then in Process Explorer's Process menu, select Search Online.... For example, click on the process lsass.exe and you'll learn that it's the Local Security Authentication Server responsible for the enforcement of the security policy within the Windows operating system.
Process Explorer is great for determining which process is hogging your CPU. In the upper pane click on the CPU column title to arrange the list of processes in order of which process is using the most processor time. You should see System Idle Process at the top followed by procexp.exe itself, unless you have something else running.
Process Explorer can also determine which process is using the most memory. In the upper pane click on the Private Bytes column title to arrange the list of processes in order of which process is using the most memory. Working Set is the amount of virtual memory used by a process, both private and shared.
To protect your PC from viruses and malware it's important to become familiar with the processes that normally run. Learn their file locations and the amount of CPU time and memory they use. Sometimes hackers give a virus the same name or a name close to that of a legitimate process in order to confuse those looking to eliminate the virus.
If you suspect a process to be malware, you can right-click on a process and in the popup menu that appears, select Suspend, or select Kill Process Tree and then Kill Process. See how your PC runs with that process deactivated.

Learn more at amazon.com
More Windows Troubleshooting Articles:
• Troubleshoot Windows 7 with Problem Steps Recorder
• Video - Using the Problem Steps Recorder Tool
• NTOSKRNL Missing or Corrupt Error Message
• Video - How to Use Memtest86+ to Test Your PC's Memory Subsystem
• How to Fix Hard Drive Errors and Slowdown
• Video - Dell Laptop CPU Replacement Tutorial
• Windows 10 Built-in Troubleshooters
• Hard Drive Does Not Boot
• MSCORSVW.EXE Hogging CPU resources?
• Examining Computer Hardware Components

