Entity-Relationship Diagrams
By Anna Korlyakova
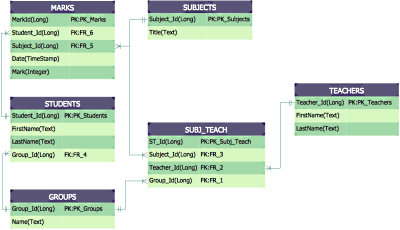
This diagram was created in ConceptDraw PRO
using the ERD, Crow’s Foot Notation Library from the Entity-Relationship Diagram (ERD) Solution.
An experienced user spent 15 minutes creating this sample.
Creating an entity-relationship (ER) model is to visually represent the structure of
a business database, where data equates to entities (or objects) that are linked by defined
relationships expressing dependencies and requirements. By nature it is an abstract visualization,
the first step in the design process towards creating a logical and functional database.
The original concept was formalized by Peter Chen, the influential computer scientist who
wrote The Entity-Relationship Model - Towards a Unified View of Data. This paper provided structured
notation for database models - it remains a well-used standard to this day, but other notations,
such as Bachman, Barker, or Martin, have been devised to handle specific database requirements.
Entity-relationship diagrams (ERD) follow the common three-schema approach to software
engineering, with three levels of abstraction being used to define an ER model.
Conceptual data model - A conceptual data model is the most abstract view of a data model.
It offers a complete overview of a business area, including all significant business entities,
and describing their relationships.
It omits further levels of detail, including data types and interface definitions, making
it suitable as a means of presenting an initial business idea to a wide range of stakeholders.
Logical data model - Using this model a higher level of detail is established, with data
entities describes as master, operational or transaction, and the relationships between them
more precisely defined. This is the testing phase of a data model, where functionality can
be observed independently of physical specifications.
Physical data model - At this point data modelers start to take into account the physical
constraints of the database area. Important factors to consider are database performance, physical
storage space, and indexing strategy. Diagram notations will fully define all tables and columns,
indexes, constrain definitions, and any linking or partitioned tables.
Creating an ERD requires choosing a specific set of notations that best serve the specific
database being designed. Chen's original notation had a linguistic approach, where boxes representing
entities could be thought of as nouns, and the relationships between them were in verb form,
shown on a diagram as a diamond.
Eventually Chen's style was adapted into the crow's foot notation, where relationships
were shown as single labelled lines - this quickly became the popular standard, due to improved
readability on diagrams, with a more efficient use of space on the page.
Most other notation systems are adaptations, or use part of these original styles. Here
is a brief list of some of the other standards that have been developed:
• Bachman notation
• Barker's notation (ERDs for Oracle)
• EXPRESS and EXPRESS-G notation
• DEFX1
• UML class diagrams
• Merise
• Object role modelling
• (min - max) notation
ERDs are an invaluable tool for software engineers, particularly since computing capacity,
and thus data storage capacity, has markedly increased in recent years. They allow every aspect
of database design to be managed, tested and communicated before implementation. Because ERDs
have such a broad scope of influence across database activities, it's imperative the standardized
notation can be utilized and interpreted by a wide variety of stakeholders.
To create an ERD, software engineers will mainly turn to dedicated drawing software,
which will contain the full notation resources for their specific database design.
The ConceptDraw Entity-Relationship Diagram solution
contains vector stencil image libraries with full standardized Chen and crow's foot notation included.
Added to the solution pack are a number of ERD templates and samples to help kick start users own ideas.
| 


