If you're a frequent user of disk maintenance tools, you might have encountered this file before. Most disk cleaners include this in the list of data that can be safely removed, such as the temporary internet files and recycle bin contents. If you're not familiar with what a Windows memory dump file is, read on.
How is it created?
It would be better to start off on how this file is formed in your computer so that you can understand its function. So to continue, how is it made?
When you computer encounters a fatal system crash, it activates the Windows Blue Screen of Death ("BSOD"). In a BSOD, your explorer will stop working and a blue screen will emerge, hence the name Blue Screen of Death.
The BSOD will indicate the specific application that brought about the system crash. Afterwards, it will trigger an overall system scan to collect all the information related to the said error. It will also duplicate your computer's memory at the event of a crash. The result of this process is called a crash dump file, or most commonly known as memory dump.
What are its types?
Depending on your system settings, your computer will produce any of the following types of crash dump file:
Small memory dump (SMB)
With an average file size of 256 kilobytes, this is the smallest type of crash dump file. Because of its size, it can only store very little information about the error. Some examples of the data included in it are the blue screen information, a part of kernel data, loaded drivers, and process information. The SMB is used to identify the specific error has caused the crash. Since it only contains an insignificant part of the kernel data, you cannot use it to resolve the system error.
Kernel memory dump (KMB)
This file contains useful system data such as the hardware abstraction level (HAL), memory allocation of Windows kernel, kernel-made drivers and kernel-related programs. Because of its conciseness, the KMB is what most developers use for debugging purposes. However, this file excludes the unallocated memory, or the memory dedicated for user-made applications.
Automatic memory dump (AMB)
All Windows computers are set to produce AMB by default, and that its size is determined by the system. Windows ensures that there is enough space to capture at least a KMB. Thus, an AMB contains almost the same information as the kernel dump file.
Complete memory dump (CMB)
This type creates an exact copy of your physical memory at the moment of the system crash. It covers all information contained in every type of crash dump files and adds more to it, that's why it's called "complete". However, most system crashes are attributed to codes in kernel-mode. This means that the information in a KMB is already adequate. Thus, it only follows that all the other data contained in a CMB apart from the kernel data is deemed useless.
How can you access it?

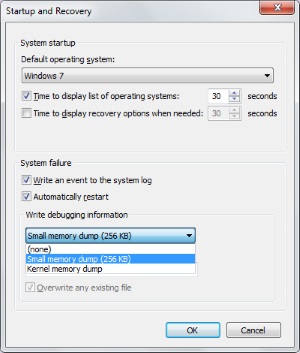
To do this, go to the Control Panel and look for the System menu. Under the Advanced system settings, there is the "Startup and Recovery" section. This contains the settings for your crash dump file.
You will see that the "Write debugging information" is default to be an AMB. If you wish to change this setting, you should use an Administrator account as this is a system setting.
Is it safe to delete it?
If your system has already recovered from a system error, then it's okay to delete it. Most crash dump files are typically large in size. The CMB file, for example, can take up gigabytes of storage in your hard drive. Therefore, it is recommended for this file to be removed especially if you're running low on memory.
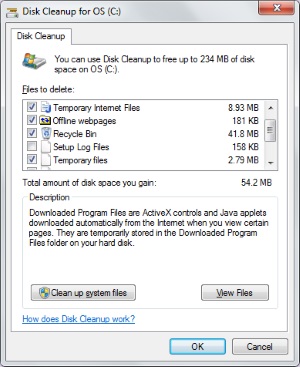
To delete your crash dump files, you can run this Disk Cleanup utility which is pre-installed in Windows. To use this tool, proceed with the following steps.

1. Click the Start menu.
2. Under All Programs, choose Accessories.
3. Under Accessories, choose System Tools.
4. The Disk Cleanup dialog box should appear.
5. Select the specific drive that you want to clean up.
6. Click on the [OK] button. The Disk Cleanup will analyze the contents of your drive.
7. Check the System error memory dump files.
8. Click on the [OK] button.
Given the technical nature of this file, normal users cannot use this to solve computer errors. The crash dump files are sent to Windows developers so that they can examine the nature of the crash. Hopefully, they could provide Windows users with a patch to prevent that system error from happening again.
If you are looking for a free pc optimizer to restore missing corrupted files, you can download for free on dlltool.com This domain name is for sale]
More Windows Troubleshooting Articles:
• Introduction to Windows 10 Resource Monitor
• Windows XP's Built-in Help and Support Center
• How to Repair Low Memory Errors
• No Computer Sound
• The Blue Screen of Death (BSOD)
• Buffer Underrun and Overrun Scenarios
• How To Fix The Windows 1301 Error
• How to Fix msvcrt40.dll Error
• How to Fix logoncli.dll Error
• Understanding the boot.ini File

