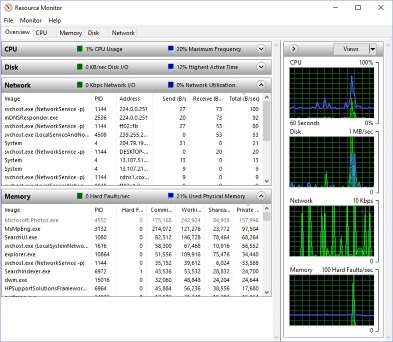
Resource Monitor is a visual tool that system administrators can use to examine how various parameters of a Windows system are performing. To access Performance Monitor:
1. In Control Panel, click on the Administrative Tools icon.
2. In the Administrative Tools windows that appears, double-click on the Resource Monitor icon.

Resource Monitor opens with its Overview tab selected. The Overview page displays an overview of system resources: CPU, Memory, Disk, and Network. The other tabs: CPU, Memory, Disk, and Network provide more details about specific categories of system resources.
The Memory tab displays the memory being used by each running process, along with what Physical Memory is being used for; In Use, Modified, Standby, and Free. On the CPU tab you can check the box for a specific process and the bottom window will display only the activity for that process. On the Disk tab you can see read-write activity for each specific process.
The Network tab is the most interesting as it displays which programs are accessing the network and which IP address they are connected to. It also shows which ports are being blocked by the firewall.
Because Resource Monitor provides in-depth information about a wide range system activity, it is probably your most powerful tool for monitoring, analyzing, and troubleshooting the system.
More Windows Troubleshooting Articles:
• View Hidden Devices with Device Manager
• Video - Common Laptop Problems
• Troubleshoot With Reliability Monitor
• How to Troubleshoot, Dissemble, and Repair a Laptop Display
• How to Fix Svchost.exe Error
• Get Remote Technical Assistance
• Why Don't I Get Sound From My PC?
• Repairing Internet Explorer
• Free Firewall - ZoneAlarm
• Stop Hard Disk Thrashing

