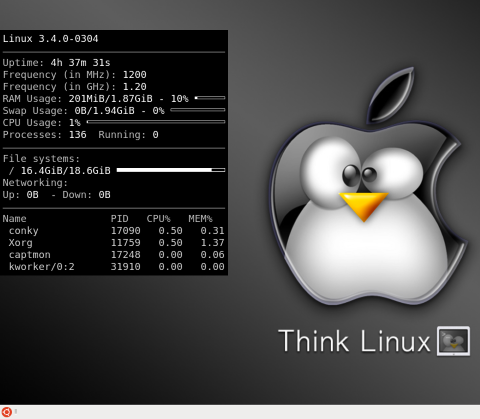
Widgets are support programs to equip KDE or Gnome desktop, well-known by Linux users. They simplify indication process for lots of parameters: from processor loading and core temperature to calendar and weather (OS Windows call these applications gadgets). As a rule, such programs are connected with desktop environment, thus they can demand more dependencies while installing. For those who get used to effective work with computer resources, conky, as a universal system monitor, will rouse some interest. The main peculiarity of this program is the usage of X Window System functionality to display data on the desktop, be it XFCE, IceWM, KDE, or any other.
At first start, conky's appearance may seem constraint, but don't underestimate it at once.

The official website gives proper documentation which can also be found if you type in console:
$ man conky
In this article, we'll show you the most important configuration parameters. Firstly, copy the configuration file to the home directory:
$ cp /etc/conky/conky.conf ~/.conkyrc
and adjust it to your preferences. It is worth mentioning that there's a division of a configuration file into two parts where the first defines appearance and window position, and the second (under TEXT tag) is responsible for data shown by the system monitor. With the help of first section parameters we can preset the position of a window. Let's take the right upper corner:
alignment top_right
The arrangement is a combination of key words top, bottom, middle, right, left. To render application in its window we use Boolean variable
own_window yes
if we set "no", the window will overlay all objects on the desktop. The transparency command is performed by:
own_window_transparent yes
To update conky gradually, it's necessary to turn on the double buffering and refresh time in seconds. At the same time, we remember that frequent window update requires system resources:
double_buffer yes
update_interval 2
It is possible to change the color of a font in Xft library not to offend the eye
use_xft yes
xftfont Georgia:size=12
Now, let's turn to the second part of a configuration which is an output formation. Expectedly, the first user's desire can be to install the time and date in a comfortable format
${color white}${font size=10}${alignc}${voffset 6}${time %A %e %B %G}
${color white}${font Neuropol:size=30}${alignc}${time %l:%M}
Let us consider the text given above. Code of input interface becomes intuitively clear: it is obvious that all parameters have the form of ${variable option}, where the variable can adopt the value of color (the color of the text), alignc (puts the text to the center), font (makes up the necessary font), execi (executes a shell command with the specific interval), etc. Variables, in their turn, can have additional parameters such as font color and size. If the parameter isn't mentioned, it is set by default. Line ${time %l:%M} sets 12-hour time format output.
You can input the information about the core with:
${color}${font StyleBats:size=12}${font}${color white}Kernel: ${color}${kernel}
Processor usage graphic can be viewed with cpugraph, which among its parameters has: core number (cpuN), height and length of the window, and the color of progress bar:
${cpugraph cpu1 25,120 FFFFFF FFFFFF} $alignr${cpugraph cpu2 25,120 FFFFFF FFFFFF}
To see temperature on your hardware you need to install lm-sensors. Then, sort out lines by the key word (command grep) and symbols with temperature (command cut -c) :
${color white}CPU:          ${execi 2 sensors | grep temp1 | cut -c 16-17}°?
${color white}Core 1:       ${execi 2 sensors | grep Core\ 0 | cut -c 16-17}°?
${color white}Core 2:       ${execi 2 sensors | grep Core\ 1 | cut -c 16-17}°?
/dev/sda:  ${execi 2 /usr/sbin/hddtemp /dev/sda -q | awk '{print $3; }' | cut -c 1-2}°?
Monitoring of RAM and file system use is also performed by the built-in variable:
$mem (amount of RAM used), $swap (amount of swap using), ${fs_free path} (free space in file system in a given way - path):
${color white}RAM:  ${color white} $memperc% $mem/$memmax
${color white}${membar 3,245}
${color white}SWAP: ${color white} $swapperc% $swap/$swapmax
${color white}${swapbar 3,245}

${color white}Root:    ${color white}${fs_free /}/${fs_size /}
${color white}${fs_bar 3,245 /}
${color white}Home:    ${color white}${fs_free /home}/${fs_size /home}
${color white}${fs_bar 3,245 /home}
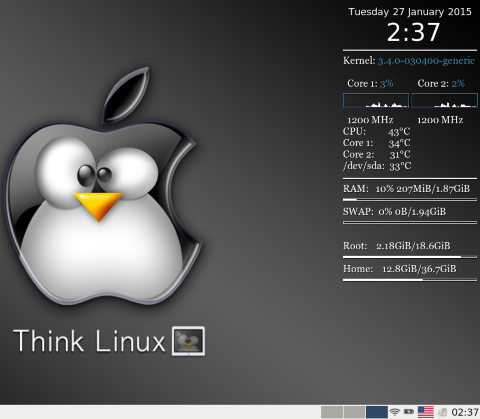
Finally, we've got proper system monitor on the environment of desktop XFCE:

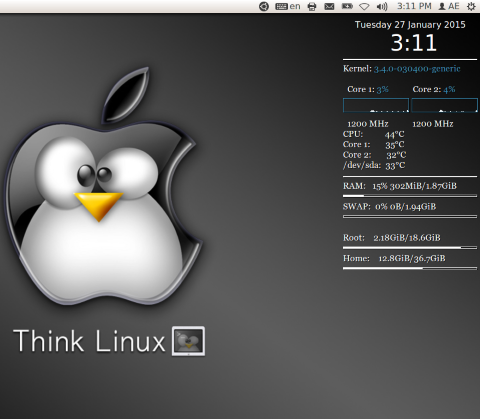
The same widget launched on Unity desktop:

Thus, here is a conclusion: spending at least some time to adjust conky's configuration, we get powerful instrument to monitor system resources with standard output that doesn't depend on the desktop environment. You can download file .conkyrc from this link.
Article's author: Derek Berrington PhD in Engineering Sciences, expert in physics and programming at AssignmentExpert
More Windows Administration Information:
• An introduction to the Linux Boot and Startup Processes
• Tips for top: Monitoring CPU load on Linux
• Working With Files in Linux
• Protect Your Android Device From Malware
• What is Bash?
• Running Windows Applications on Linux
• How to Protect Files and Directories in Linux
• Know linux
• Bootloaders In Linux
• What Is the Android Operating System?

